You may have noticed a new tab on your Build screen: VM Monitoring ![]()
We’re excited to introduce resource usage metrics for Bitrise build VMs! Now you can track CPU, memory, disk, and network usage during your builds, giving you deeper insight into performance and resource demands.
Why this matters:
See exactly how your builds use VM resources so you can spot bottlenecks. If builds are slowing down, you’ll know if it’s time to upgrade your VM. Alternatively, if you’re not utilizing all your resources, you can save money by opting for a smaller machine.
What you can monitor:
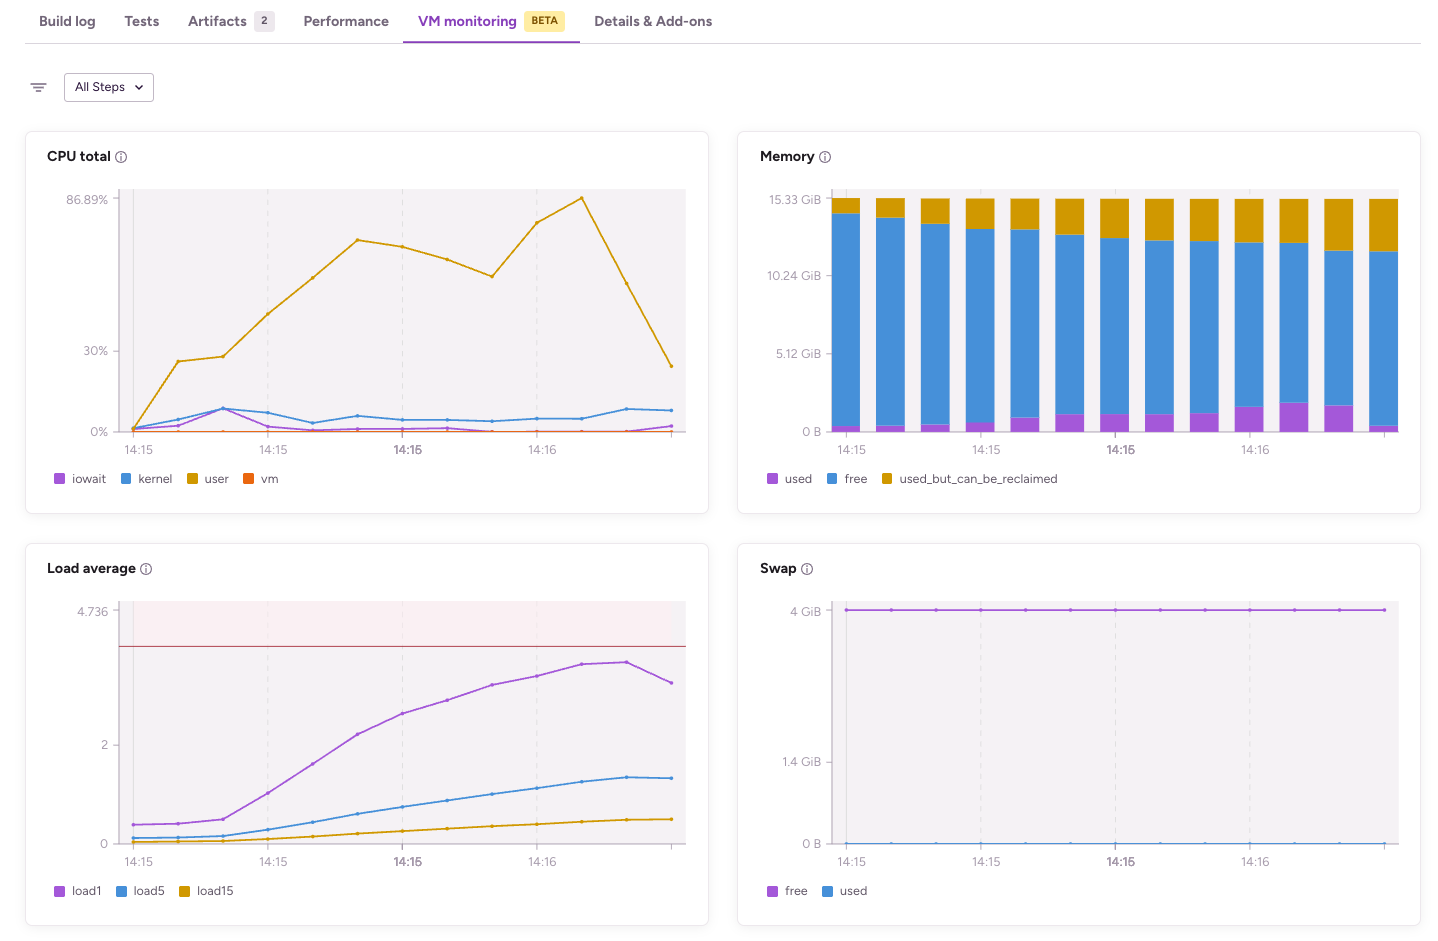
- CPU usage: Time spent running your apps and system processes, including waiting for I/O or running emulators.
- Memory usage: Breakdown of free, used, and reclaimable memory, so you understand what’s available or being heavily used.
- Load average: The average number of processes running or waiting over 1, 5, and 15 minutes - helping spot overloads when these exceed your VM’s CPU cores.
- Swap usage: When memory swaps to disk, which can slow builds, you’ll see how often this happens.
- Network usage: Data sent/received on each network interface, helping you track bandwidth per connection.
- Disk usage: Storage space used and available on specific file system mount paths.
- Disk throughput: Read/write speeds on each disk, showing how much data your storage is handling.
Smart filters for better insights:
Filter metrics by individual steps, network interfaces, disks, or mount paths to focus on what matters most for your builds.
This is in beta at the moment. We’re keen on feedback ![]()
Happy building ![]()